Menu

Login

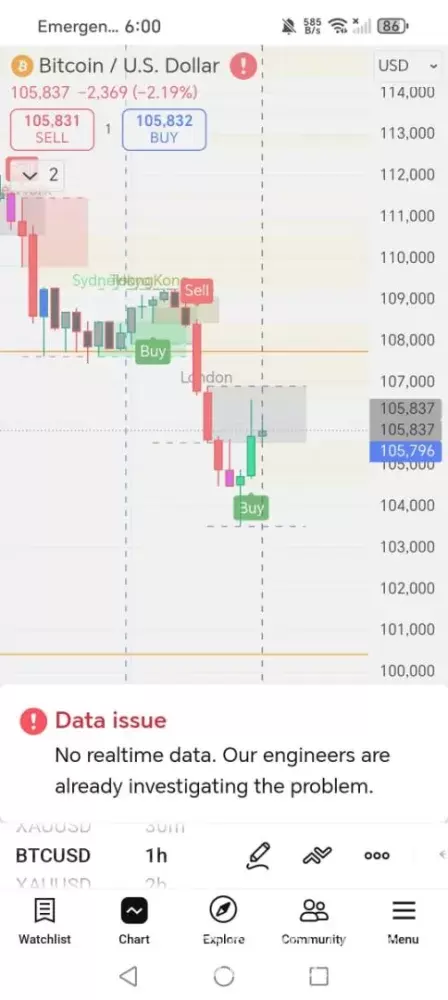
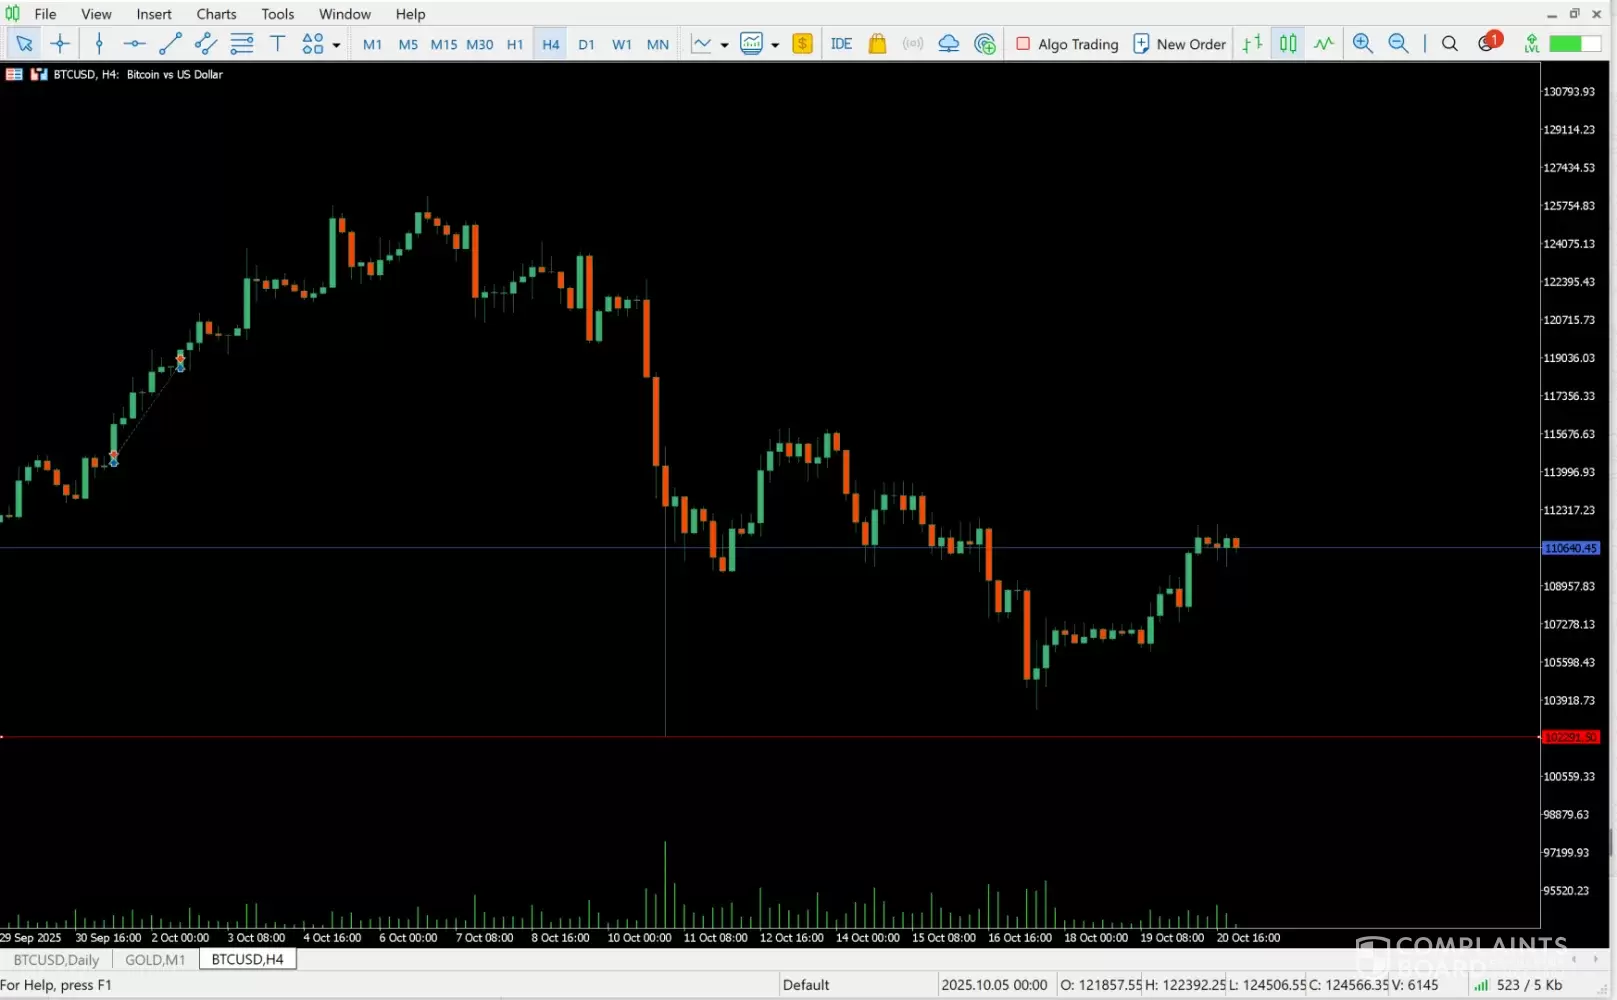
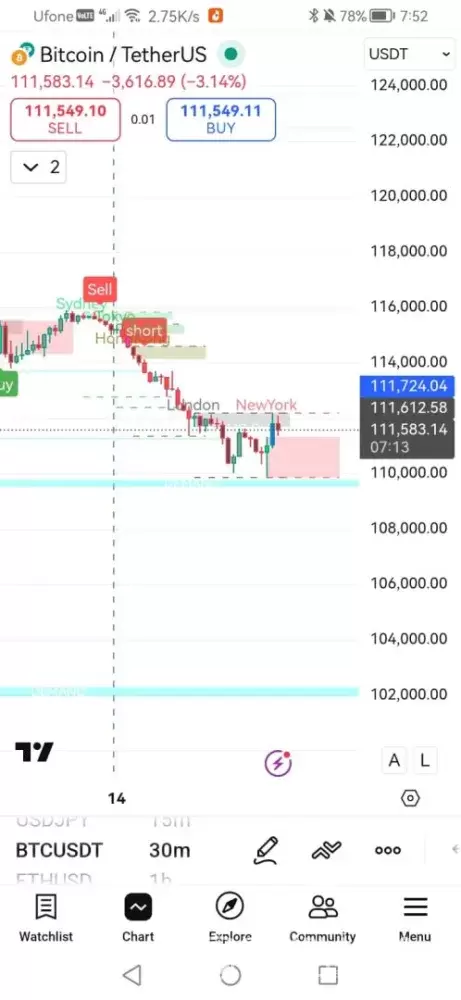
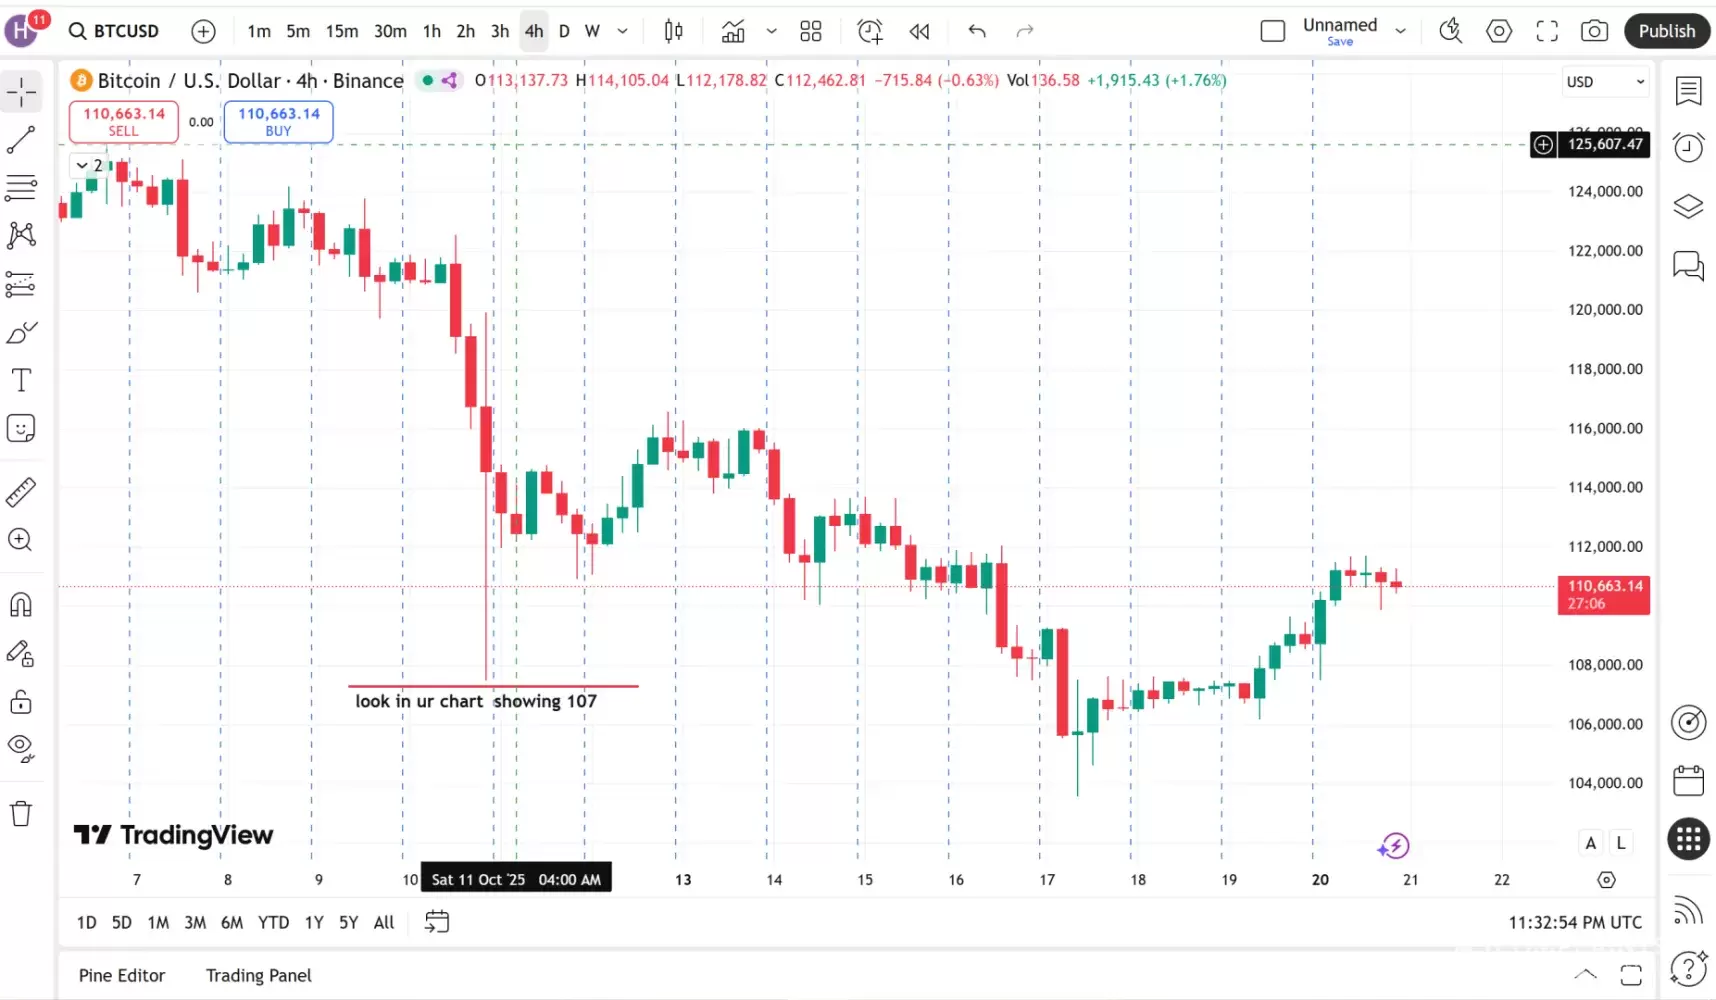
Trading View's BTCUSD chart has been displaying inaccurate price data since October 13. The actual market low was 102, but the chart shows 107 as the bottom, omitting the real dip. This misrepresentation can mislead traders and raises serious concerns about data integrity and trust. The issue persists across multiple devices and browsers, and has not been acknowledged or corrected.
Steps To Reproduce: Open https://www.tradingview.com/chart and load the BTCUSD chart.
Set the timeframe to Intraday (e.g., 1-minute or 5-minute) and scroll to October 13.
Observe the lowest candle value shown as 107, while actual market data from other exchanges (e.g.meta5, gocharting) shows a low of 102.
Compare with external sources to confirm the discrepancy.
Repeat the test on different browsers or devices to confirm consistency
Impact
This vulnerability directly affects the integrity of TradingView’s financial data, specifically the BTCUSD chart. By omitting the actual market low of 102 and displaying 107 instead, the platform presents a distorted view of price action. This misrepresentation can:
Mislead traders into making incorrect decisions based on false support/resistance levels.
Undermine trust in TradingView’s data reliability, especially for algorithmic and technical analysis users.
Create potential for financial loss, particularly for intraday and scalping strategies that rely on precise price points.
Raise concerns of data manipulation or filtering, which can damage TradingView’s reputation in the trading community.
Critically, this error has global consequences. The actual low of 102 was a valid demand zone where institutional and retail order blocks were placed. By failing to display this level, TradingView has effectively erased a key price structure from the chart. I have attached a screenshot showing the original order block at 102, along with your system notification stating that engineers were investigating the issue. Despite this, the vulnerability was not resolved.
When the market retraces to this zone, traders worldwide will be misled into placing trades at incorrect levels—resulting in widespread losses. This is not a theoretical risk; it is a direct consequence of TradingView’s charting failure. The responsibility for these losses lies with the platform’s inability to reflect accurate historical data.
Given the public visibility of this chart and its use by thousands of traders, the impact is systemic, reputational, and financially damaging. The issue persists across devices and browsers, indicating a backend or rendering logic flaw rather than a client-side glitch
Confidential Information Hidden: This section contains confidential information visible to verified TradingView representatives only. If you are affiliated with TradingView, please claim your business to access these details.